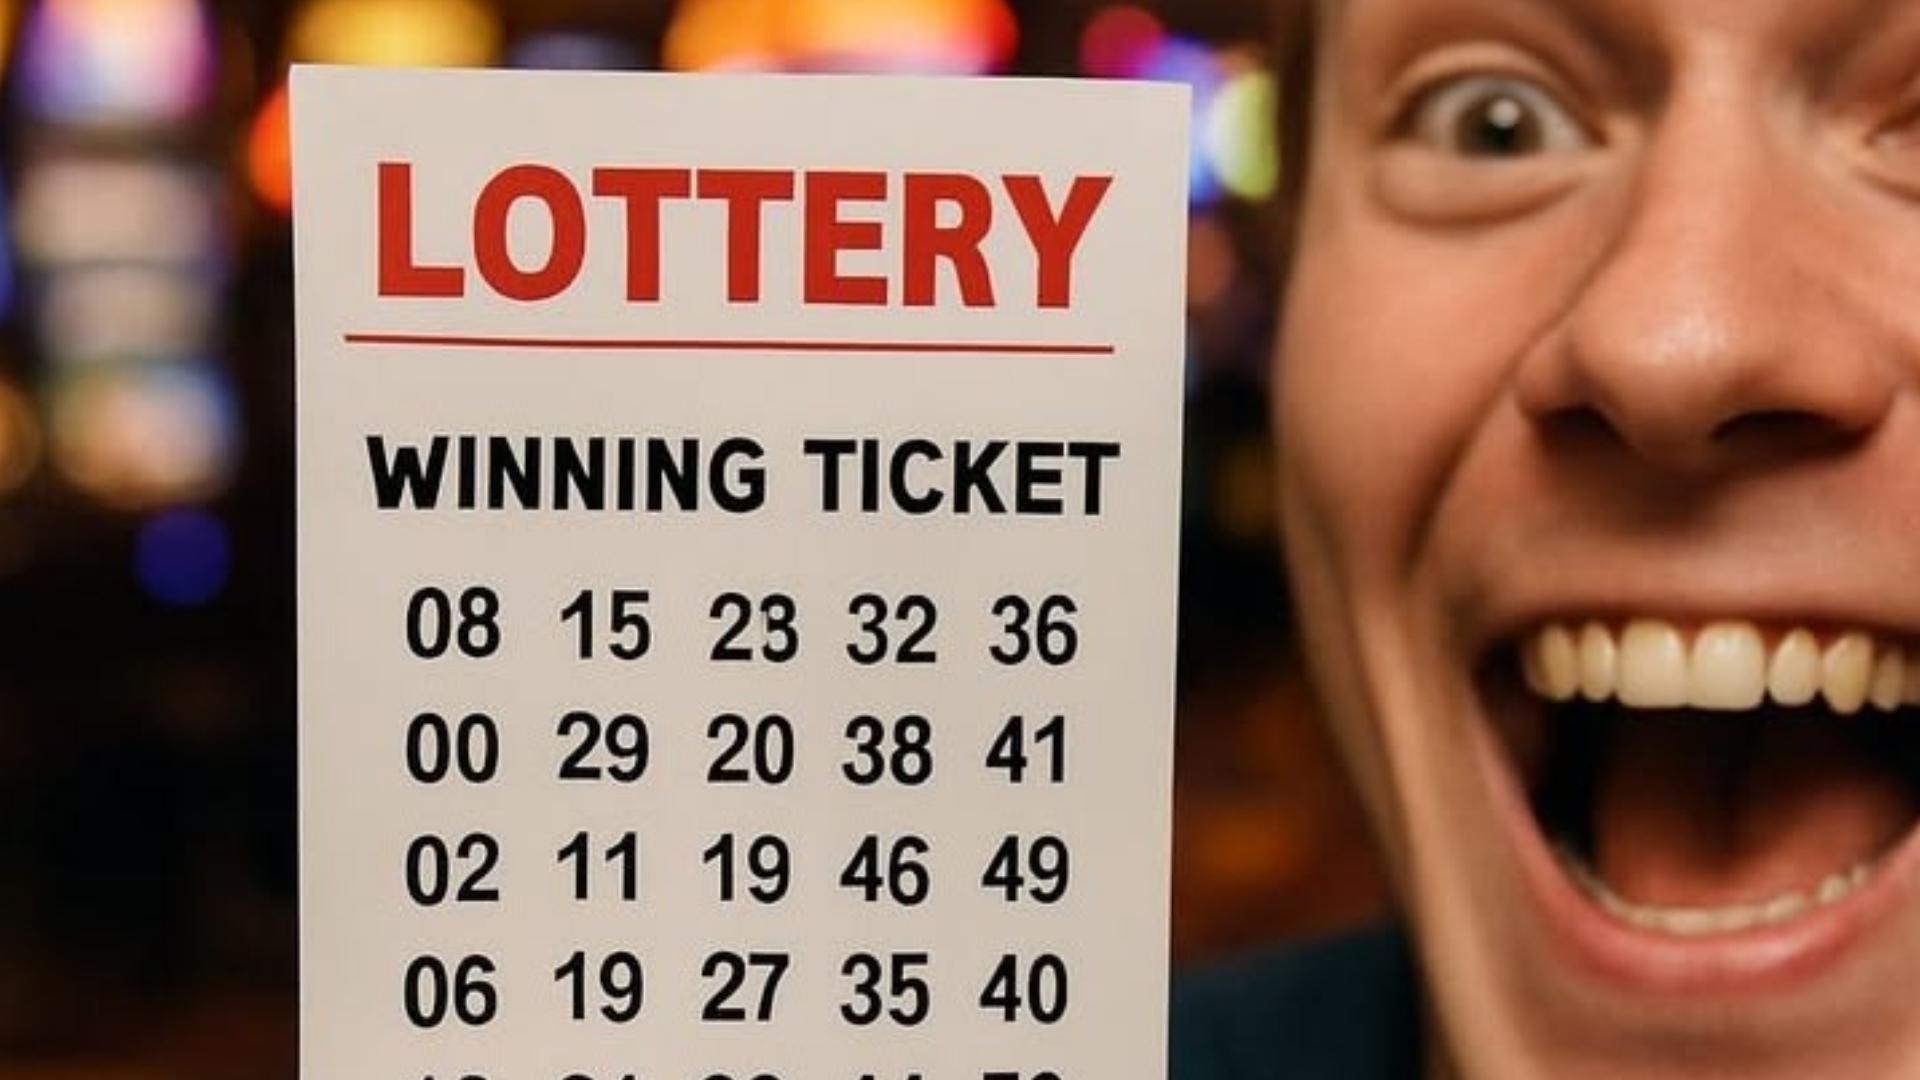
Analyzing multi-ball number draws requires a structured approach to understand how multiple outcomes interact simultaneously. Probability density functions provide a continuous framework for modeling outcomes when numerical values are converted into aggregate metrics such as averages or sums. By examining these statistical distribution models, analysts can better evaluate expected variance and long-term statistical behaviors in complex draw environments.
Understanding Continuous Models in Multi-Ball Systems
While individual ball selections represent discrete events, evaluating the overall spread of outcomes often relies on continuous approximations. A probability density function maps the likelihood of a variable falling within a specific continuous range rather than an isolated point. This approach allows researchers to model overall numerical patterns across thousands of simulated selection rounds.
When multiple balls are drawn concurrently, the sum total of the drawn numbers creates a predictable curve. As more numbers are introduced into each draw, the resulting outcome distribution naturally trends toward a smooth bell shape. This mathematical transition helps demystify how random systems organize into structured distributions over time.
The Influence of Central Tendencies and Expected Sums
In multi-ball drawings, extreme combinations—such as selecting only the lowest or highest possible numbers—occur far less frequently than moderate combinations. The central limit theorem explains why aggregate sums tend to cluster around the median value of the available pool. Understanding this central tendency gives analysts clear expectations regarding standard session metrics.
By utilizing probability density functions, statistical tools can pinpoint the exact probability of an outcome falling within a defined distance from the mean. This measurement allows researchers to define realistic prediction intervals rather than relying on intuitive guesses. Consequently, visual distribution curves serve as essential tools for evaluating systemic variance.
Evaluating Variance Across Complex Combinations
The variance of a multi-ball draw measures how broadly spread the outcomes are around the average value. High variance indicates that outcomes frequently hit wider extremes, while low variance keeps outcomes tightly grouped near the center. Modeling variance using density functions reveals the precise probability of witnessing unusual numerical spreads during extended observation periods.
Analyzing these mathematical frameworks provides crucial clarity for game designers, statistical researchers, and data analysts alike. Recognizing that every unique configuration alters the curve shape allows observers to judge whether a set of draw outcomes aligns with expected theoretical behavior. Ultimately, probability density functions turn raw draw data into accessible, actionable analytical insight.
Practical Applications in Digital Simulation Analysis
Modern data analysis frequently employs digital algorithms to run millions of simulated multi-ball draws in seconds. Comparing real-world or algorithmic results against continuous probability curves helps verify the unbiased nature of random number generators. Any significant deviation from the theoretical density function serves as an immediate indicator for further technical investigation.
By integrating probability density function principles into statistical audits, platforms maintain robust standards of transparency and accuracy. This rigorous mathematical validation ensures that complex multi-ball systems remain strictly fair, predictable in aggregate, and completely random on an individual basis.